Snapshot Comparison in dotTrace

dotTrace lets you spot problem portions of code with great ease and accuracy. Once all major bottlenecks are located, you can start eliminating these bottlenecks.
After you apply certain optimization effort, it would be nice to compare the performance of your application before and after the optimization.
dotTrace provides a useful feature that lets you assess the results of optimization with great precision. The feature’s called snapshot comparison.
Let’s see how it works.
It is assumed that you have saved the first snapshot (before optimization). Then you do some work on the application to optimize its bottlenecks.
To see the results of optimization, perform the following steps:
- Open the first snapshot (before optimization) in dotTrace.
- Profile your application once again to get a snapshot of the application after the optimization.
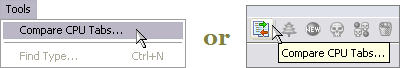
- Once the second snapshot is loaded, either choose Tools | Compare CPU Tabs on the main menu or click the Compare CPU Tabs button on the main toolbar.
dotTrace will now load the comparison snapshot. It looks like a regular snapshot but compares two states of the same application. Consider the comparison snapshot of the sample application that comes bundled with dotTrace:

It compares two working modes of the sample application. The first snapshot was taken in the slow mode, the second one in the fast mode.
The comparison snapshot offers a straightforward color-coding scheme: everything rendered green represents performance enhancements, everything red represents performance decreases.
While navigating the snapshot’s call tree, you can always get a precise indication on how much faster (or maybe slower) certain methods have become.
For each and every method you get a numerical representation of the performance enhancements. You can examine fluctuations in the following three parameters: relative change in time consumed (%), absolute change in time consumed (ms) and change in the number of calls.
Any number of custom filters can be applied to the comparison snapshot just like to a regular one. It helps you to exclude from view those items that are really of no interest to you in terms of performance alterations.
All the useful call tree navigation features are available here as well. Use To Next/Previous Unfiltered Node (Ctrl+Right/Left) and To Next/Previous Important Node (Shift+Ctrl+Right/Left) as much as you like.
Snapshot comparison is the ultimate way to assess the results of optimization and get a precise representation of the bottleneck elimination efforts.
Subscribe to a monthly digest curated from the .NET Tools blog:


