Blog
Powerful CI/CD for DevOps-centric teams
TeamCity Pipelines, our brand-new product, will make you fall in love with CI/CD ❤️
Per-minute macOS agents are now available in TeamCity Cloud! Read this blog post to learn more.
Explore what's brewing in TeamCity in 2024.
We're introducing Terraform Provider for TeamCity, an new way for configuring your CI/CD infrastructure as code.
We're introducing a new Remote type of parameters. Based on the new parameter type, we've also updated the HashiCorp Vault plugin, making it easier to use. Read on to learn what's new.
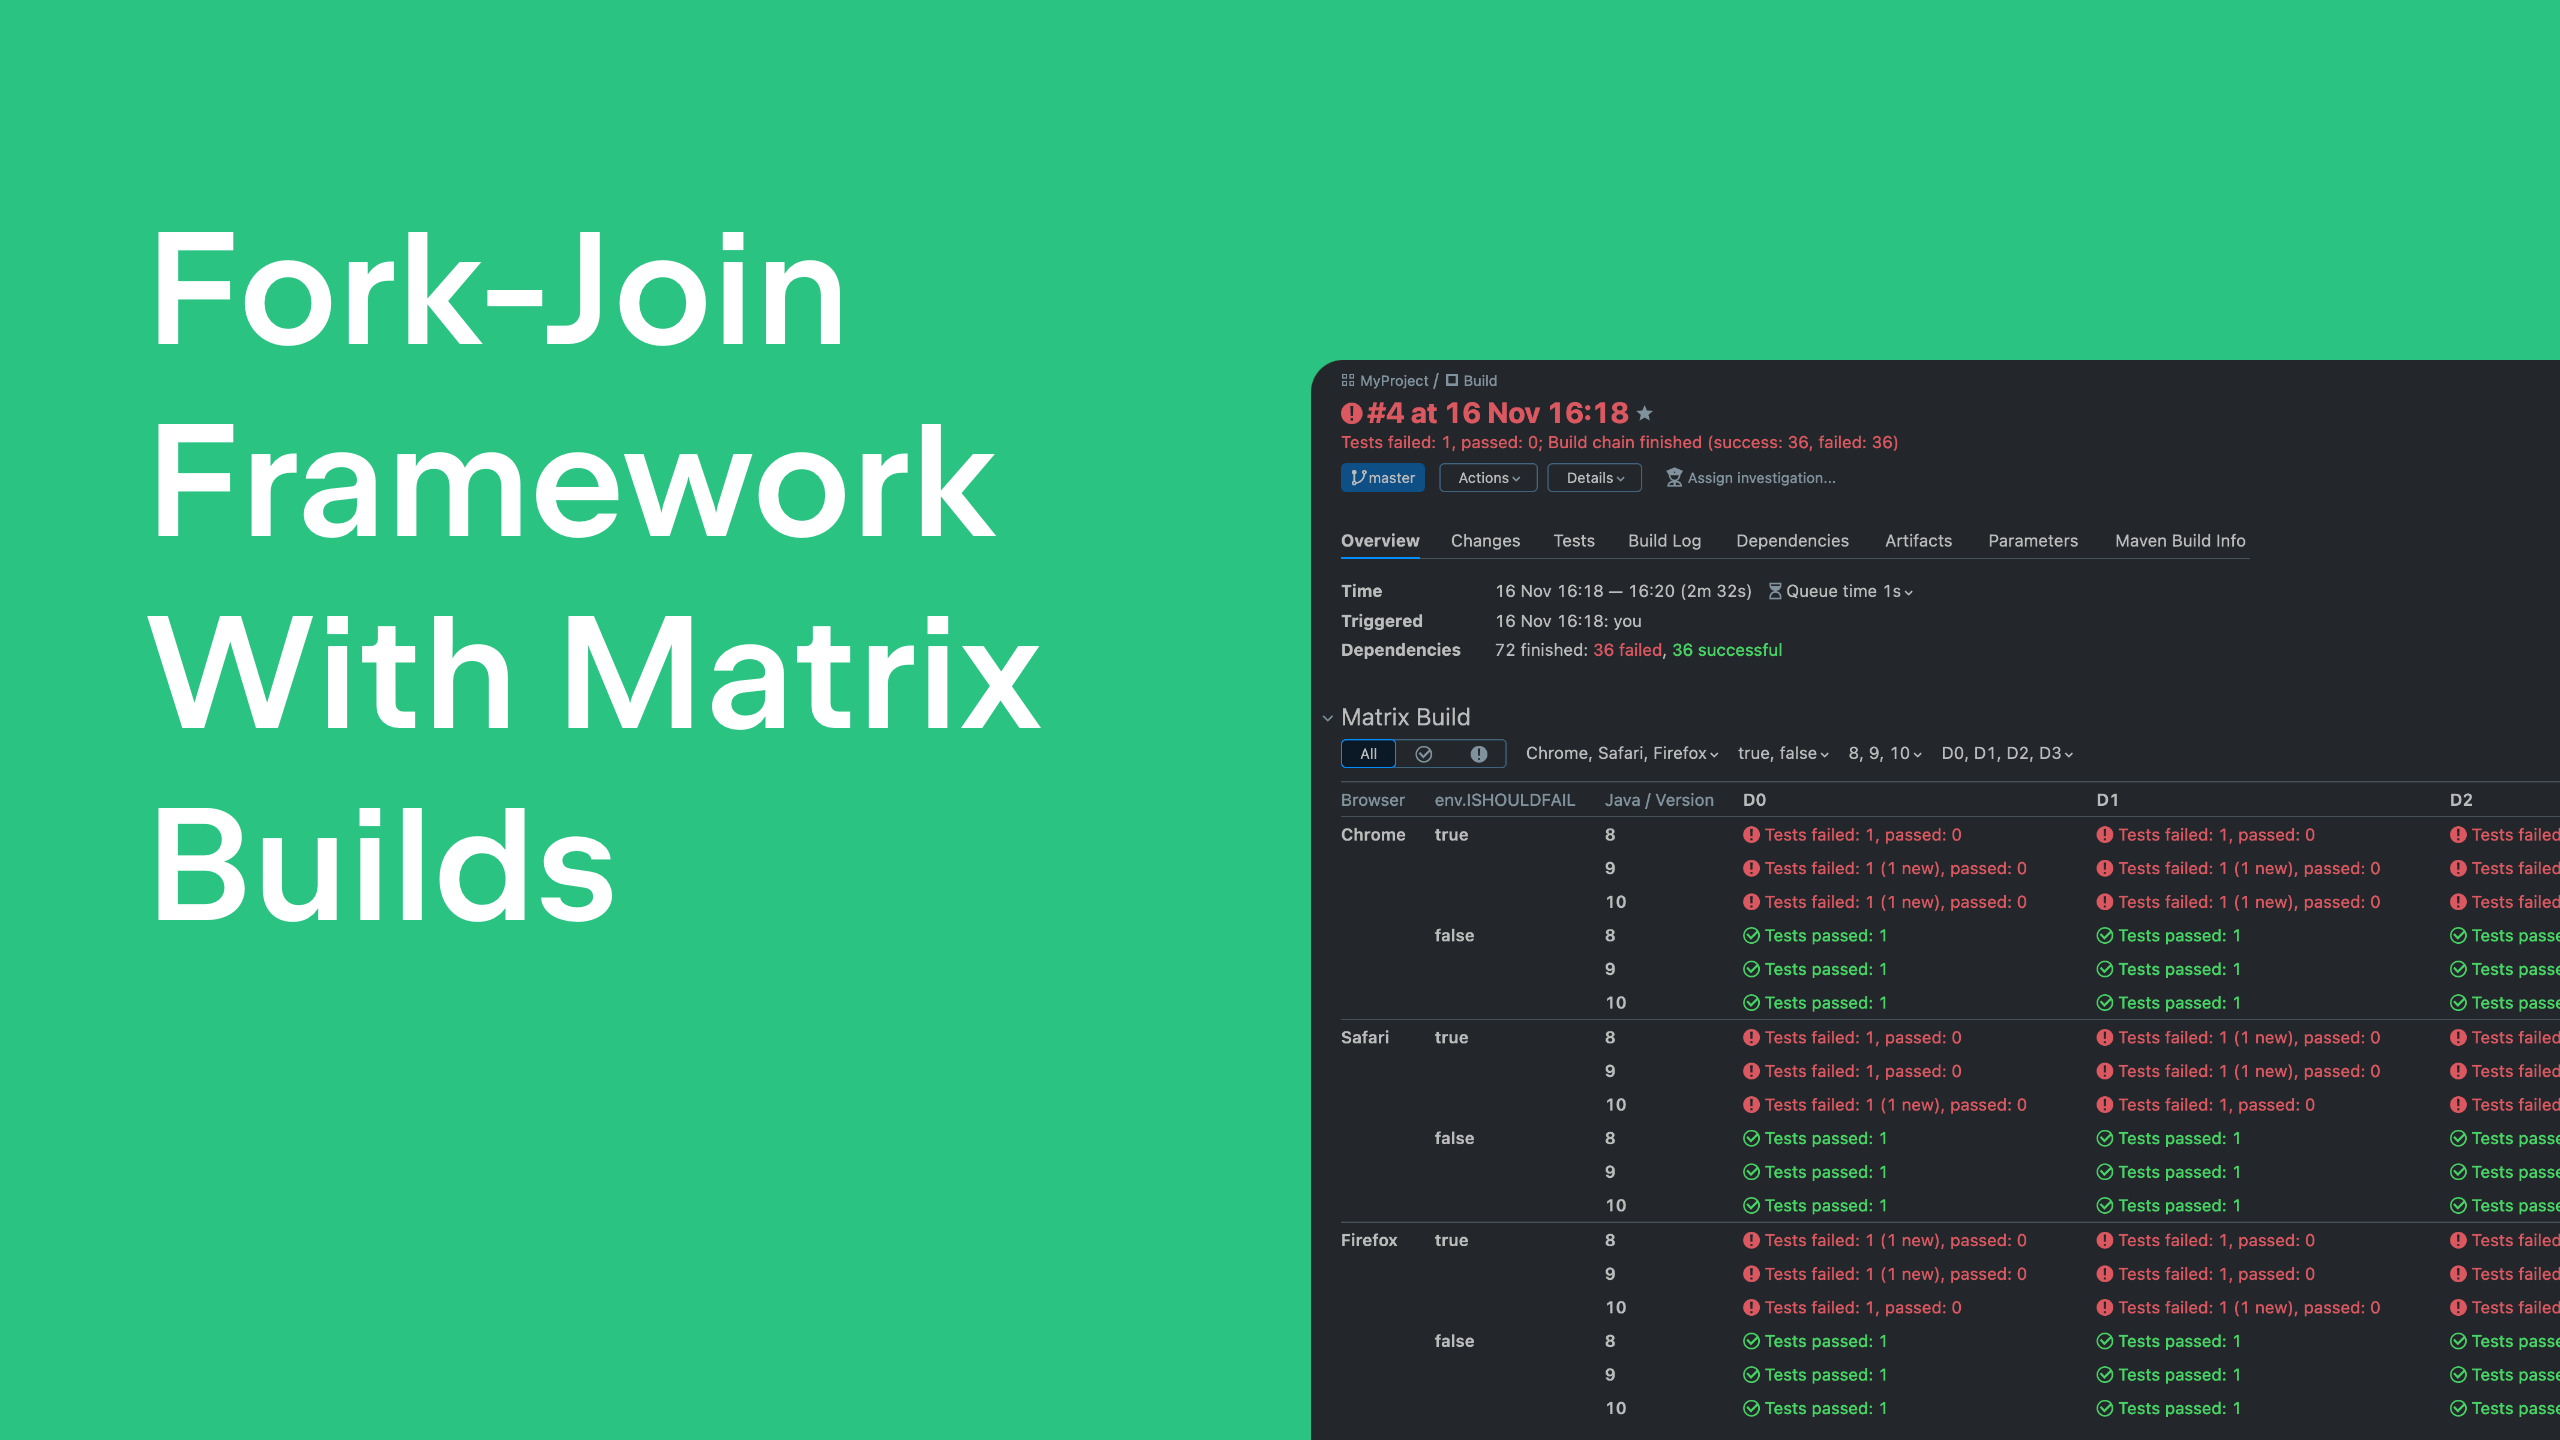
Matrix build in TeamCity executes the same set of steps on different combinations of input parameters, producing a matrix with the result of every execution, while using the Fork-Join pattern under the hood. Let’s see how this works.
We’re introducing new types of JetBrains build agents to TeamCity Cloud. Read on to find out more about them!
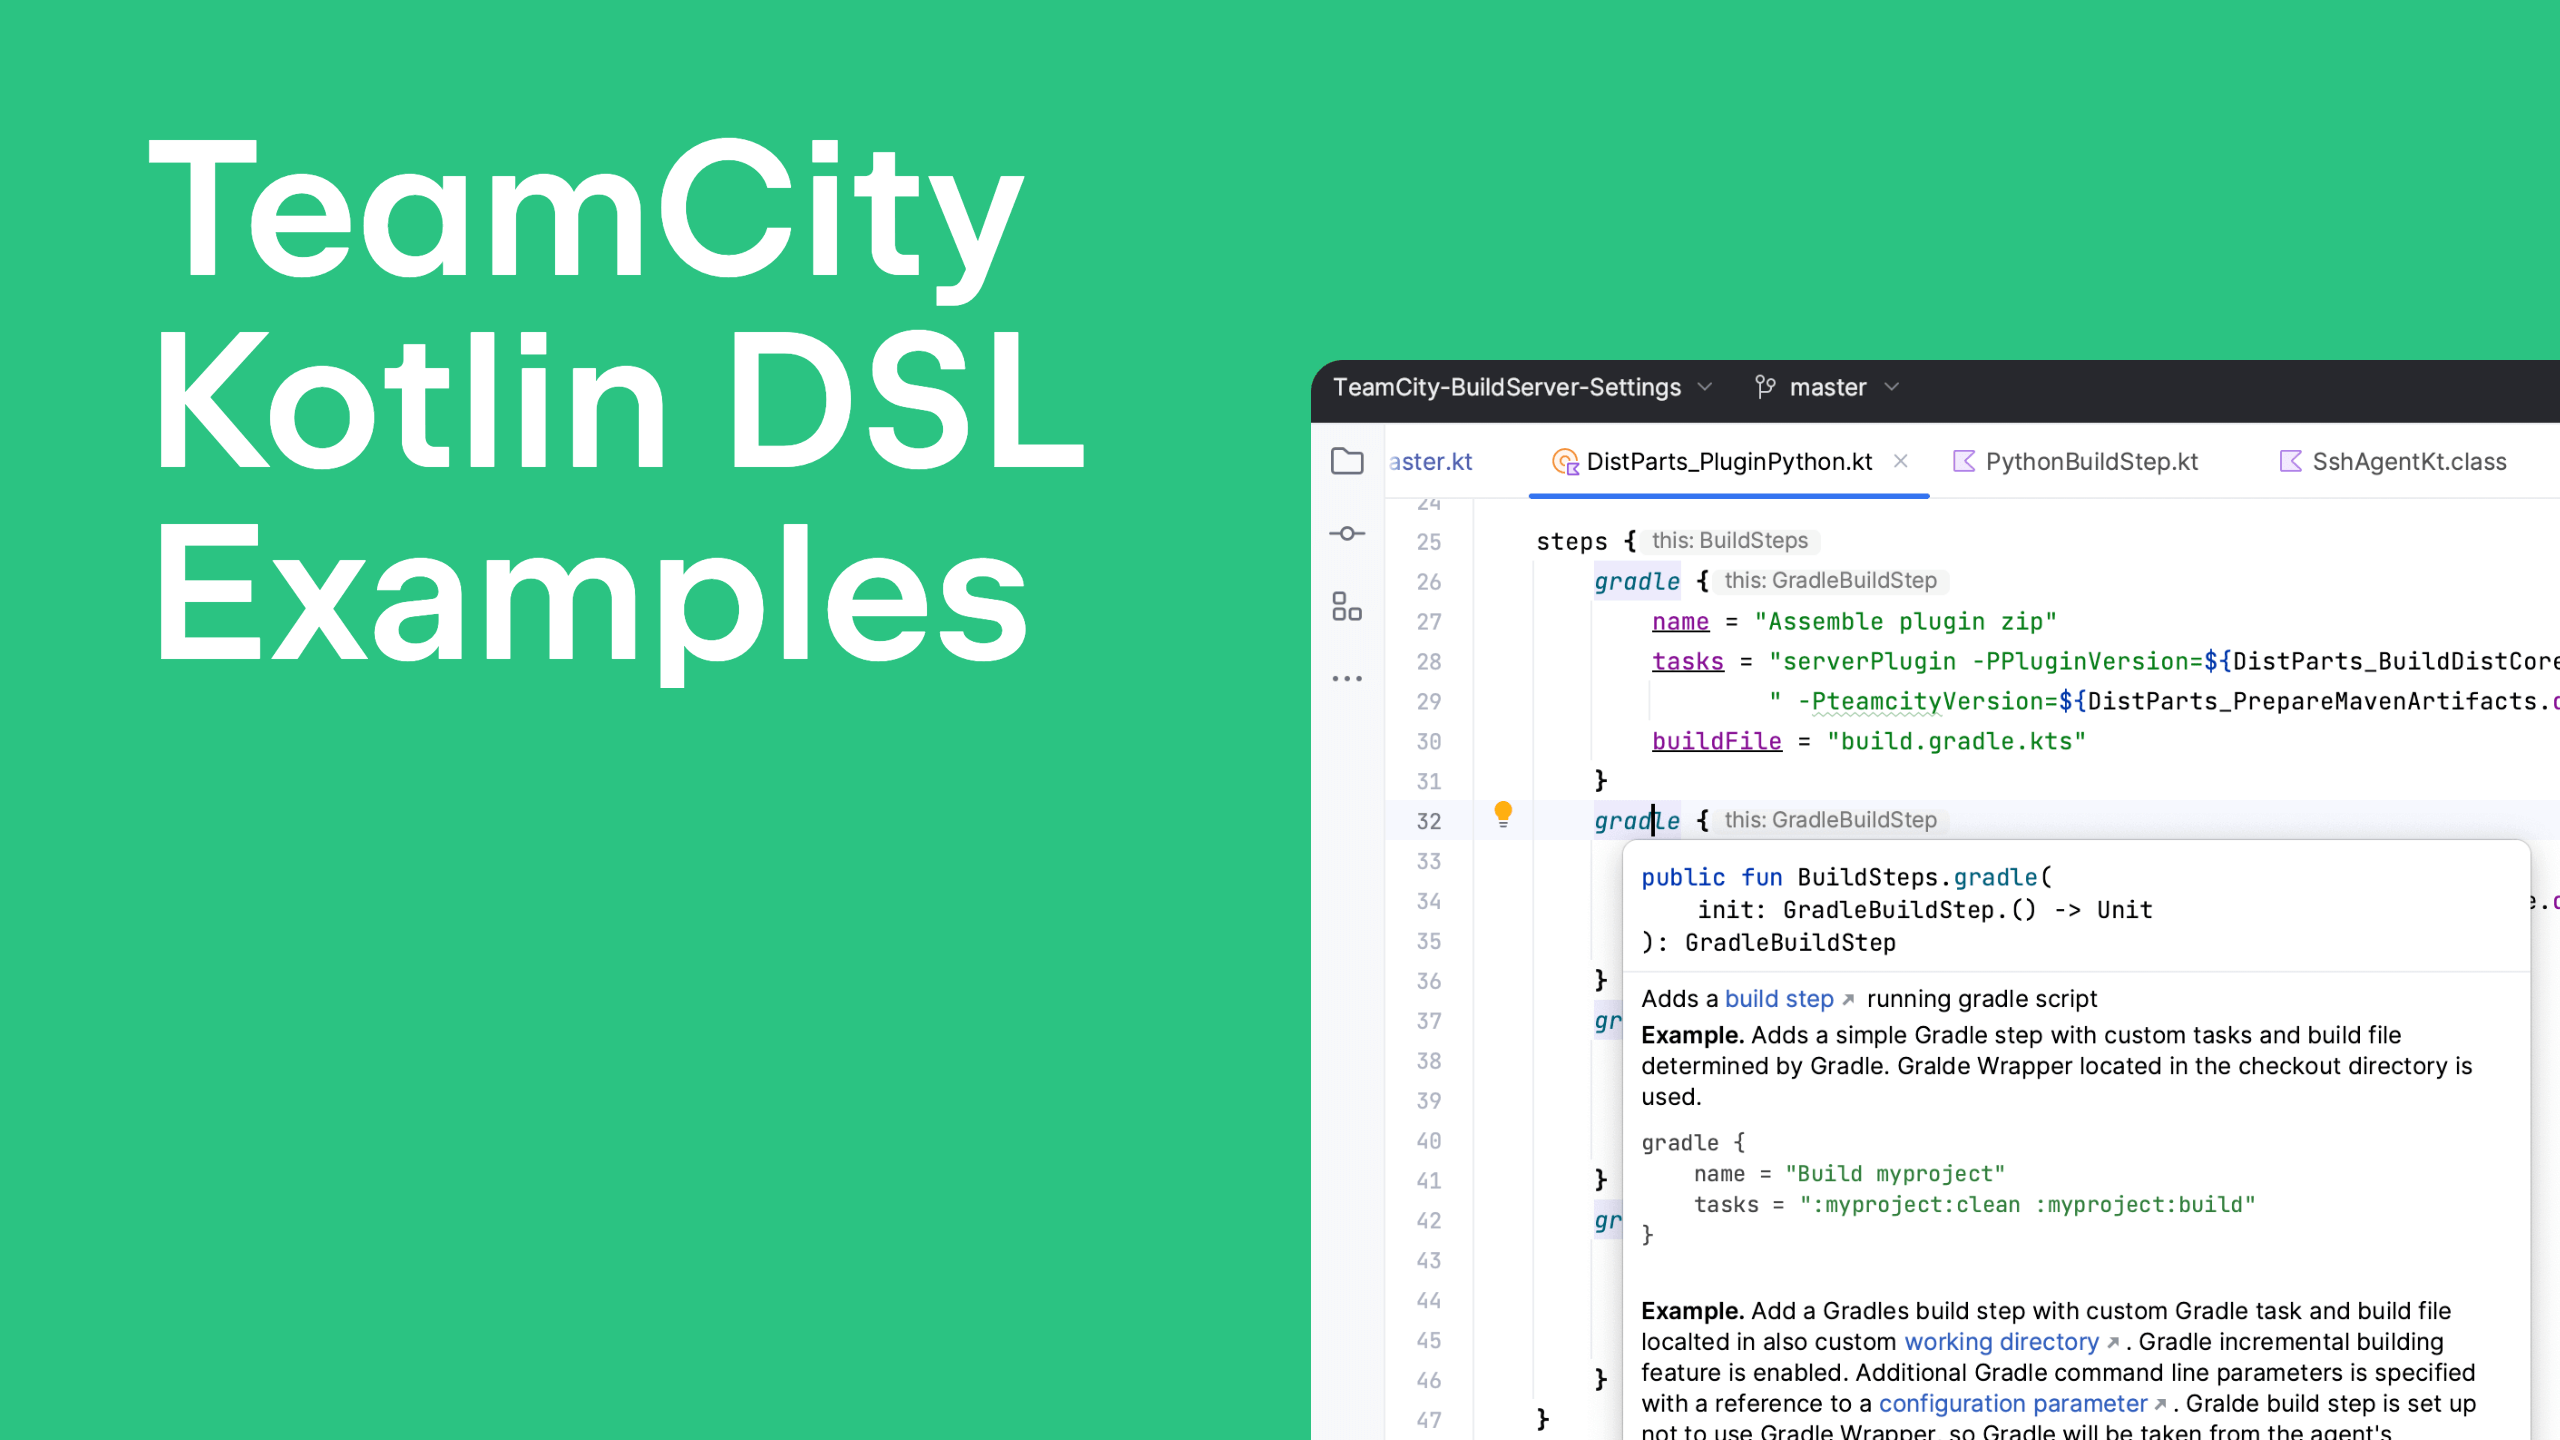
Take advantage of extensive Kotlin DSL documentation for TeamCity - now with examples! Read more about how it might increase your productivity in this blog post.
Meet agent terminals in TeamCity: the new feature that allows you to log in directly onto build agents via the TeamCity UI and makes debugging so much easier.
Datadog now offers deep, end-to-end visibility into your TeamCity builds with the new TeamCity integration for CI Pipeline Visibility.
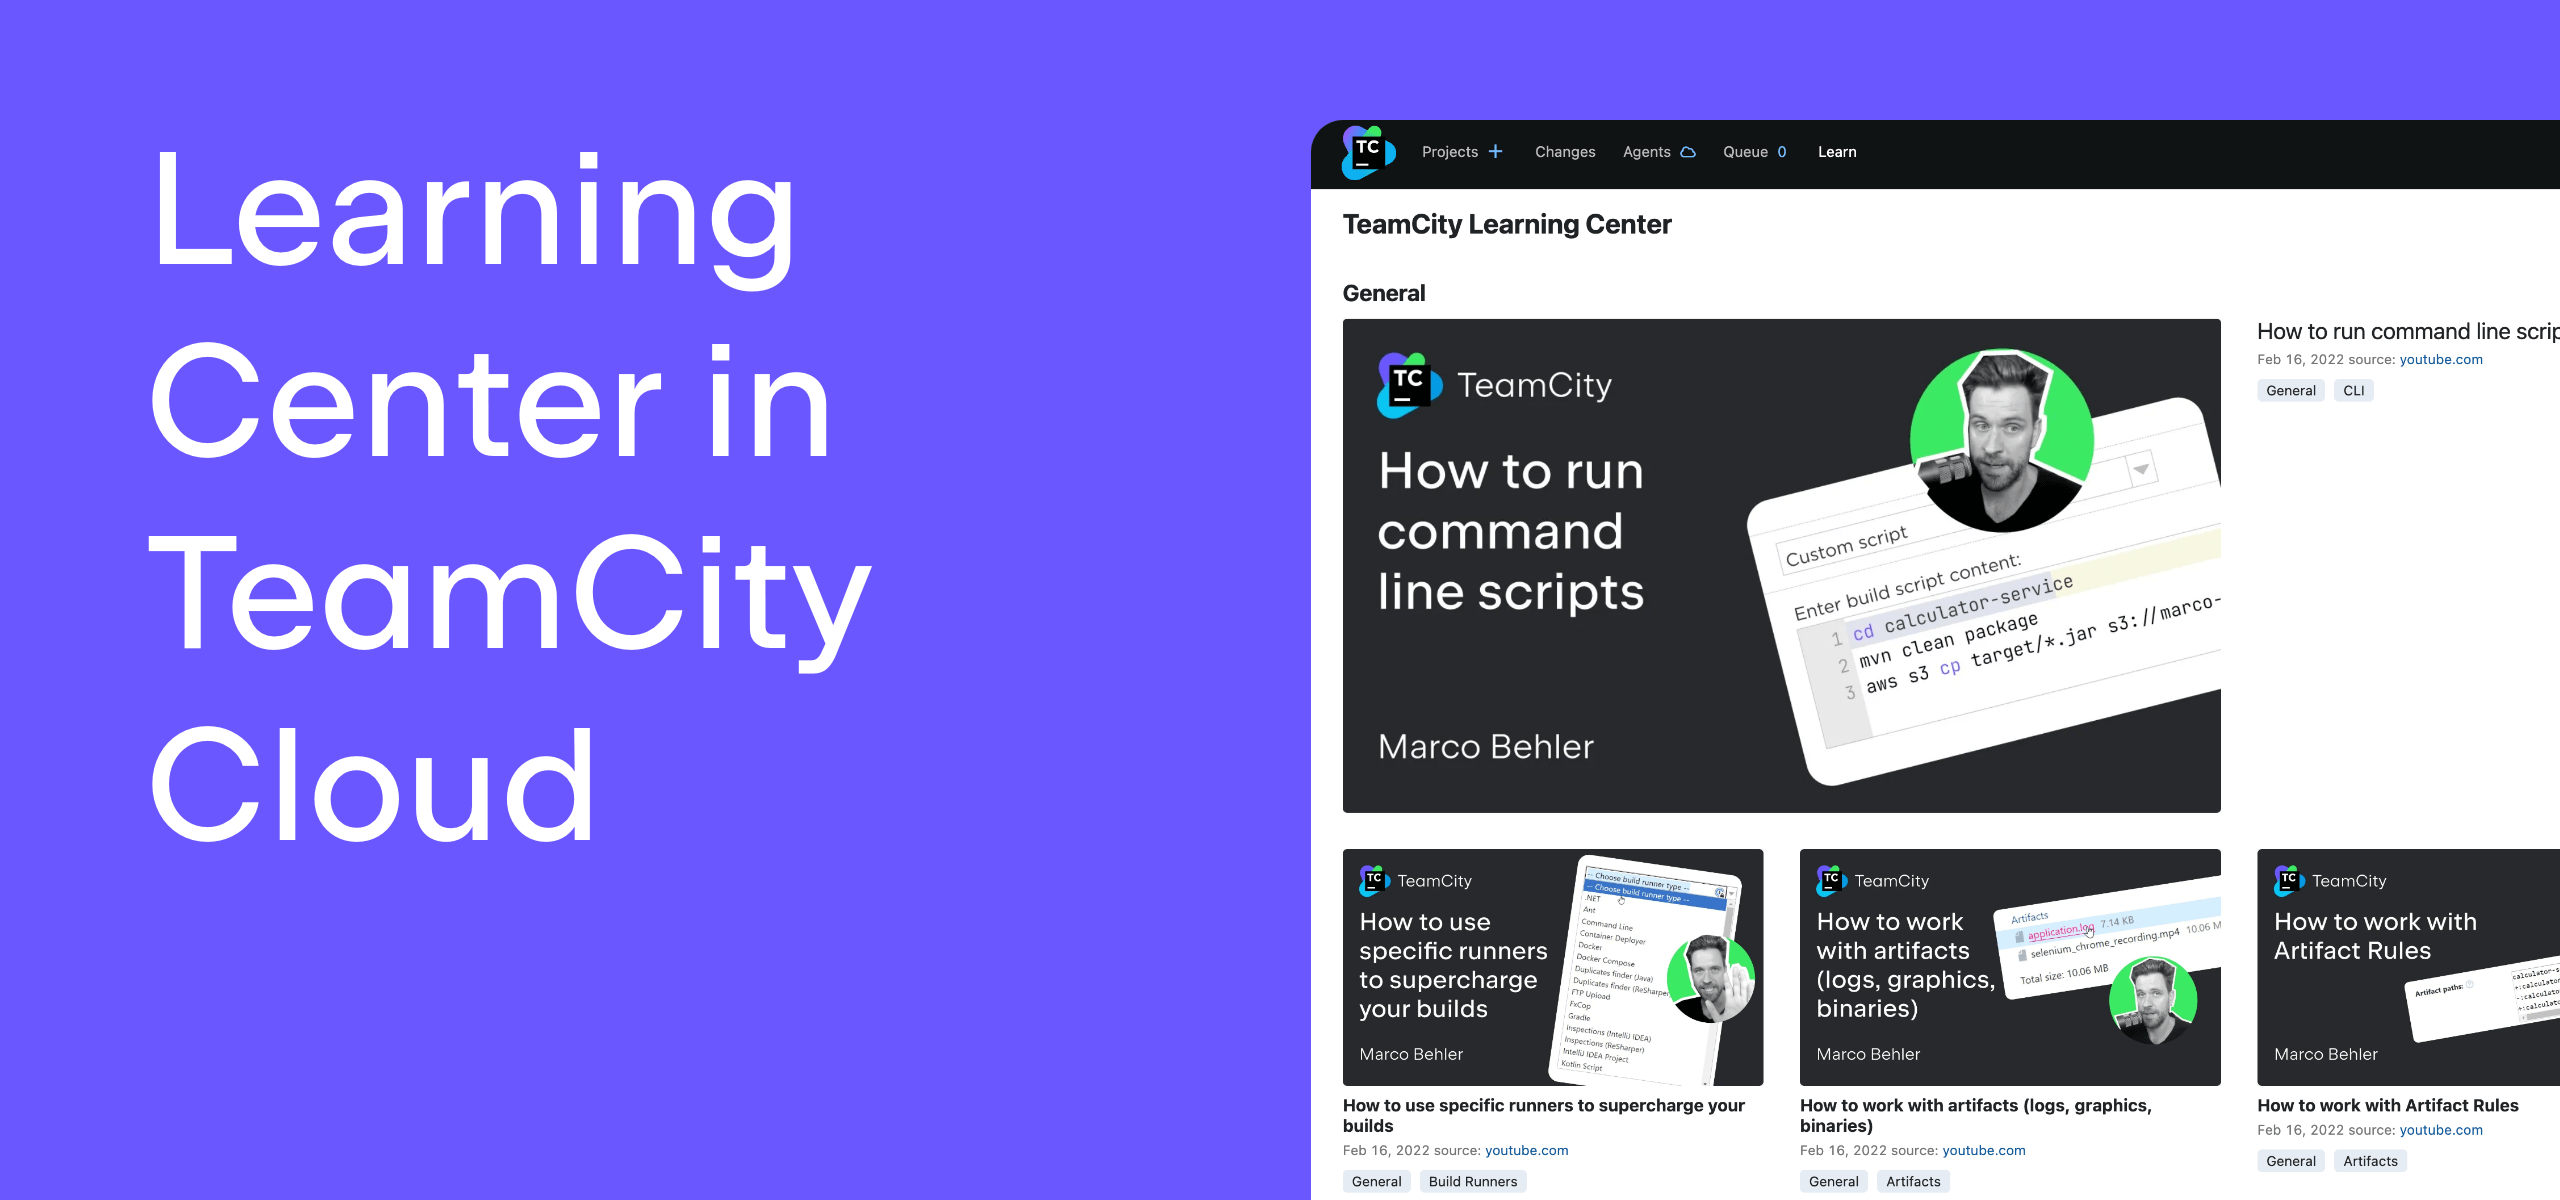
Are you looking for easy-to-consume learning materials to help you master TeamCity? Check out the new learning center available right within TeamCity Cloud.
TeamCity Cloud now offers seamless integration with Google. Google users can now create a TeamCity Cloud account using their Google accounts.